Project context
The setting
A WordPress site with a dependency-heavy front end required evidence about where mobile loading time was being spent.
Challenge
The problem to solve
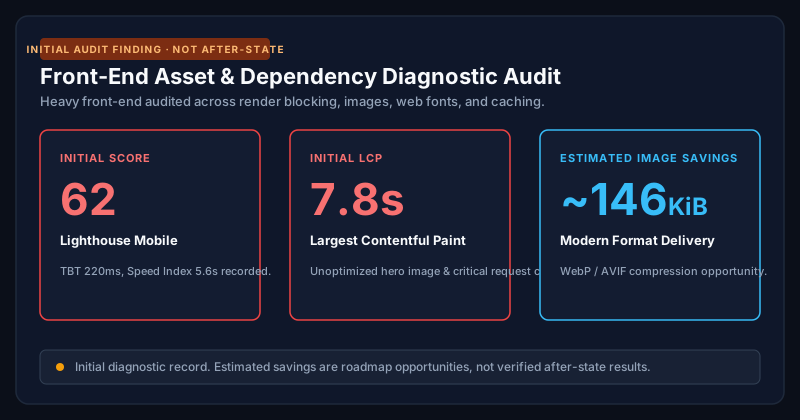
The initial mobile test recorded a 62 Performance score and 7.8-second LCP, with opportunities across render-blocking resources, caching, fonts, and images.
My role and scope
What I was responsible for
I performed the initial front-end audit, traced resource dependencies, and converted the findings into an ordered optimization plan.
Investigation and reasoning
- Inspected render-blocking CSS and critical request chains
- Reviewed large images and font-loading behaviour
- Measured cache opportunities and front-end dependency weight
Approach and implementation
- Documented the measured baseline
- Separated estimated savings from measured metrics
- Prioritised resource delivery and dependency work for implementation
Audit Findings
Audit Findings & Diagnostic Baselines
Baseline measurements and diagnostic savings potential identified during the initial investigation (not delivered after-state claims).
The audit identified significant opportunities, including an estimated 2.6 seconds in render-blocking savings and approximately 146 KiB in image savings. No verified after-state is stored, so this case study does not claim that those savings were achieved.
- Initial Performance
- 62
- Initial LCP
- 7.8s
- Estimated image saving
- ~146 KiB
Evidence note
Initial Lighthouse record: Performance 62, FCP 3.2s, LCP 7.8s, TBT 220ms, CLS 0.004, Speed Index 5.6s. No after-state is stored.
Constraints and lessons
What this work made clear
- Dependency weight needs to be traced to page value before removal
- Estimated Lighthouse savings must remain clearly separate from measured outcomes